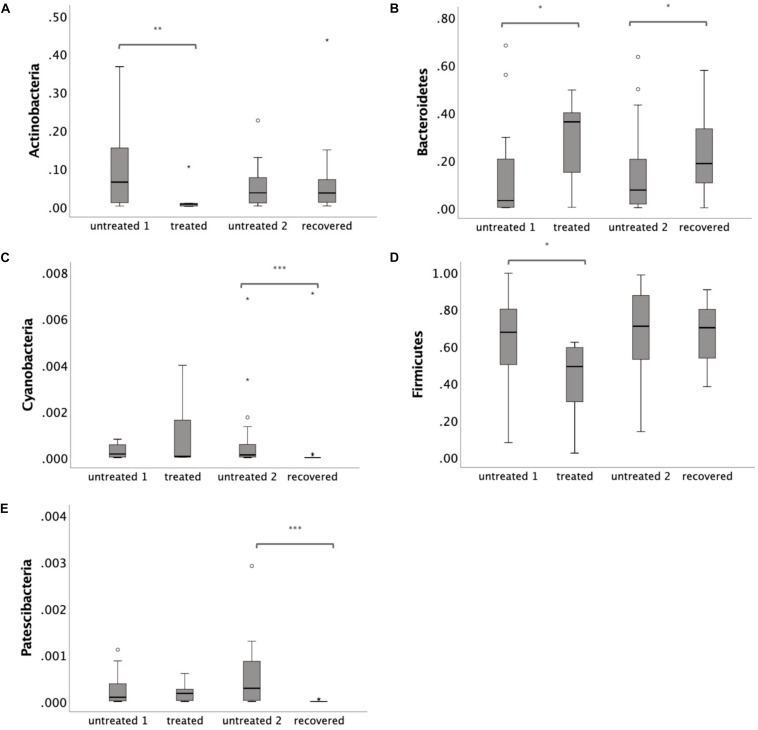
FIGURE 3.
Relative abundance of individual phylum: (A) Actinobacteria (B) Bacteroidetes (C) Cyanobacteria (D) Firmicutes and (E) Patescibacteria. Statistical significance was calculated between the multi-drug-resistant tuberculosis (MDR-TB) treated group and untreated group 1, and between the MDR-TB recovered group and untreated group 2 (Mann–Whitney U test). *p < 0.05, **p < 0.01, ***p < 0.001.

