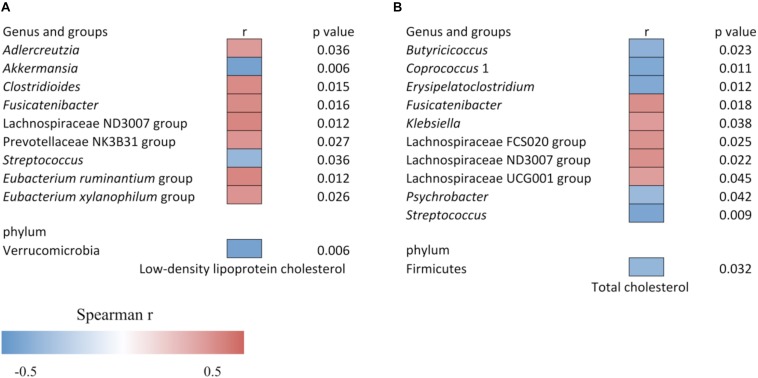
FIGURE 4.
Heat map of the Spearman correlation (A) between relative abundance of gut bacteria and low-density lipoprotein cholesterol level, and (B) between relative abundance of gut bacteria and total cholesterol level. The heat map color represents the Spearman correlation coefficient (r). Data is filtered for p < 0.05.

