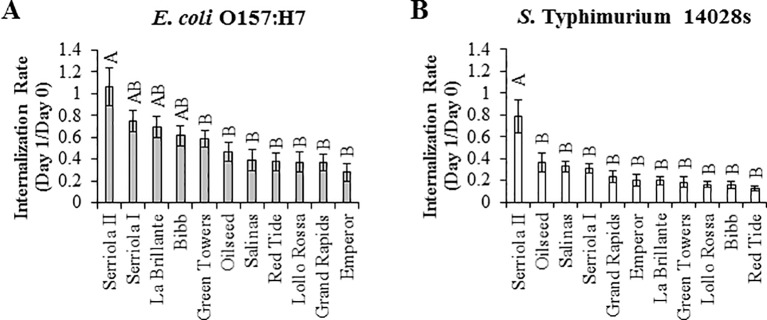
Figure 3.
The internalization rate of Escherichia coli O157:H7 (A) and Salmonella enterica Typhimurium 14028s (B) vary among the lettuce genotypes. Internalization rate was calculated as the ratio of bacterial concentration (CFU/cm2 leaf) between day 1 and day 0 after surface inoculation (1 x 10⁸ CFU/mL). Bacterial population was quantified in intact leaves for day 0 after inoculation and in leaves previously surface sterilized for day 1 after inoculation. Data shown is the average of three independent experiments (n = 9). Different letters on the top of the bars indicate significant statistical differences among the means, as calculated with ANOVA followed by Tukey’s test (α = 0.05).

