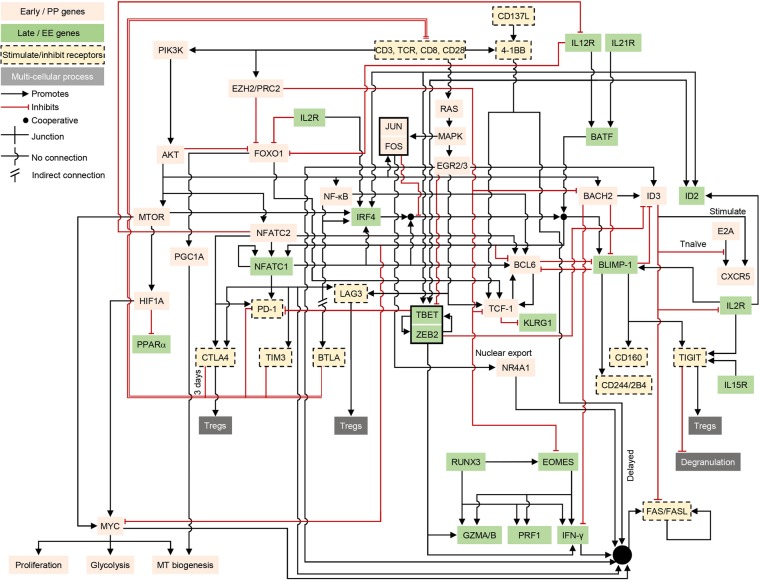
Figure 2.
A curated, literature-based network of key regulatory interactions underlying CD8+ T cell exhaustion (TCE). Red lines ending in bars indicate inhibition. Black lines ending in arrows indicate activation. Pink network nodes indicate molecules and processes associated with the early pro-memory/proliferative (PP) state. Nodes on a green background represent molecules and processes associated with the late effector/irreversibly exhausted (EE) state. For simplicity, nodes in the network represent both genes and their products and are labeled by their commonly used names across all figures. Inhibitory and related immune receptors are shown on a tan background with dashed borders. In a few cases (e.g. IL2R), a node appears more than once in the network in order to reduce line clutter. The black box around JUN/FOS indicates their cooperative role as AP-1 dimers. Likewise, T-BET and ZEB2 can act cooperatively and are grouped together. The double-edged repressive input onto the T cell receptor (TCR) complex (labeled ‘CD3, TCR, CD8, CD28’) bundles the actions of the inhibitory receptors PD-1, BTLA, CTLA-4, TIM3, and LAG3.

