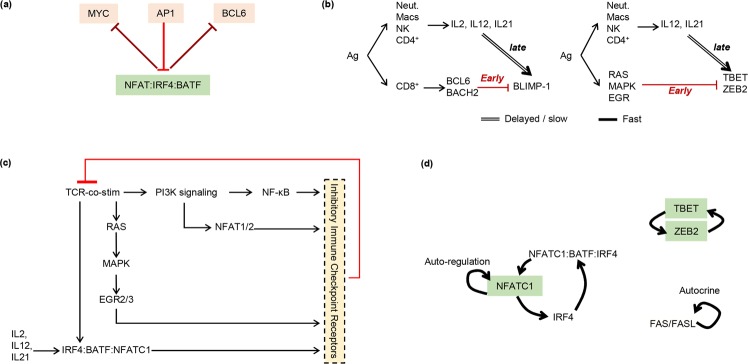
Figure 3.
Examples of network motifs in the TCE network. (a) There is widespread mutual inhibition between early (PP) and late (EE) state genes, suggesting the 2 states mutually exclude each other. Shown is an example of mutual inhibition interactions between early factors (MYC, API, and BCL6) and the late acting protein complex (NFAT:IRF4;BATF) (for the full list of mutually inhibitory interactions see Supplementary Fig. S24). (b) The expression of the PP-state driver gene TCF-1, the onset of restimulation-induced cell death (RICD) via FAS/FASL signaling, and the time of activation of the key EE state genes BLIMP-1 (aka PRDM1), TBET, and ZEB2 are each controlled by multiple, overlapping incoherent feed forward loop network motifs. Double lines mark slow/delayed processes. For simplicity only two examples of subnetworks are shown here (for the full list of subnetworks see Supplementary Fig. S24). (c) Inhibitory immune checkpoint receptors implement overlapping negative feedback inhibition of T cell activation. It should be noted that some inhibitory receptors (e.g. CTLA4, LAG3, and TIGIT) additionally exert inhibitory activity via regulatory T cells not shown here to emphasize the negative feedback on CD8/TCR signaling exerted by inhibitory receptors (more detailed representation of this subnetwork is presented in Supplementary Fig. S24). (d) Multiple positive feedback loops reinforce and maintain the late effector/irreversible exhaustion (EE) state.

