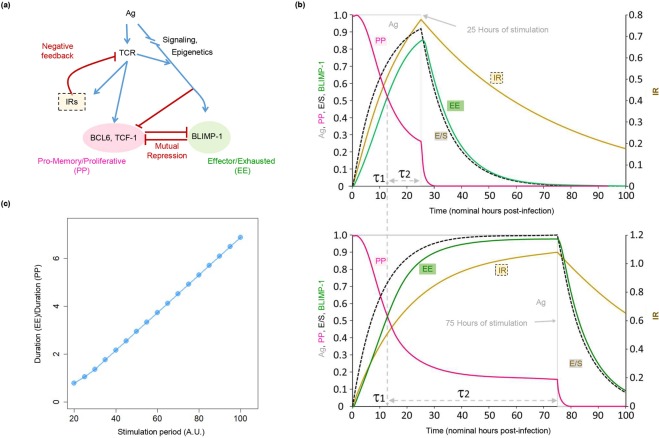
Figure 5.
Functional building block-based modeling reveals a mechanism driving T cell exhaustion (TCE). (a) Abstract representation of the overlapping incoherent feed-forward loops (iFFLs) that regulate the timing of expression/repression of key PP and EE state genes TCF-1/BCL6 and BLIMP-1. The 2 states are modeled as being mutually repressive (cf. Fig. 3a and Supplementary Fig. S24a). Additionally, inhibitory immune receptors (IRs) exert negative feedback on T cell receptor (TCR) activity. The overlapping iFFLs create a brief period of fixed length shortly after TCR stimulation, during which PP state driver genes (TCF-1 and BCL6) are active. At the end of this period, PP state genes become repressed, while EE state genes such as BLIMP-1 are simultaneously activated. A set of ordinary differential equations (ODEs) implementing this model are described in Methods. (b) Simulation results for the model in (a) under nominal ‘acute’ and ‘chronic’ stimulation conditions. The gray line shows the duration of antigen availability (nominally 25 hours for the ‘acute’ model and 75 hours for the ‘chronic’ model). The time at which the red PP-activity curve crosses the green EE-activity curve (τ1) marks the duration of time the cells spend in the PP state. The period from the end of τ1 until antigen clearance (labeled τ2) marks the duration cells spend in the effector/exhausted EE state. Comparison of the 2 simulation runs shows that τ1 remains constant irrespective of the duration of stimulation, while τ2 increases with the duration of stimulation. (c) The ratio (τ2/ τ1) as a function of stimulation period grows in approximate proportion to the total duration of stimulation, suggesting that the proportion of cells in the EE state will increase with prolonged stimulation.

