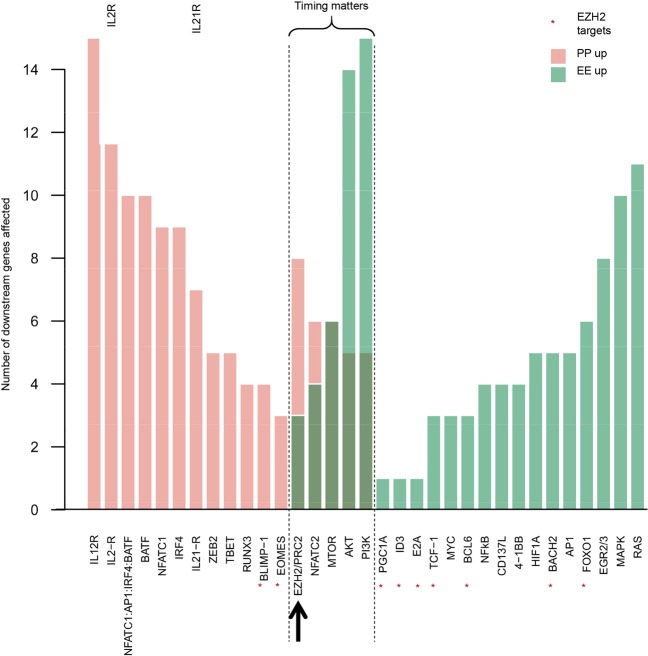
Figure 6.
Model-based prediction of the effects of interfering with the activities of genes in the TCE network. For each gene listed, bar heights show the number of downstream genes that are affected by perturbation of the regulator gene. Affected gene counts are grouped into pro-PP (PP gene up-regulated or EE gene down-regulated) and pro-EE effects (EE gene up-regulated or PP gene down-regulated). Leaf nodes (i.e. genes with no downstream targets in the network), and genes within global feedback paths (e.g. the checkpoint receptors) are excluded. Of note, inhibiting the activity of a large majority of the genes in the TCE network results in exclusively pro-PP or pro-EE effects. But a number of genes, exemplified by EZH2, appear to have both pro-PP and pro-EE effects (as an example, EZH2 targets are marked by *). As illustrated in Fig. 7a–c, these apparently contradictory effects are resolved when the activities of these genes are explored at finer time-resolutions.

