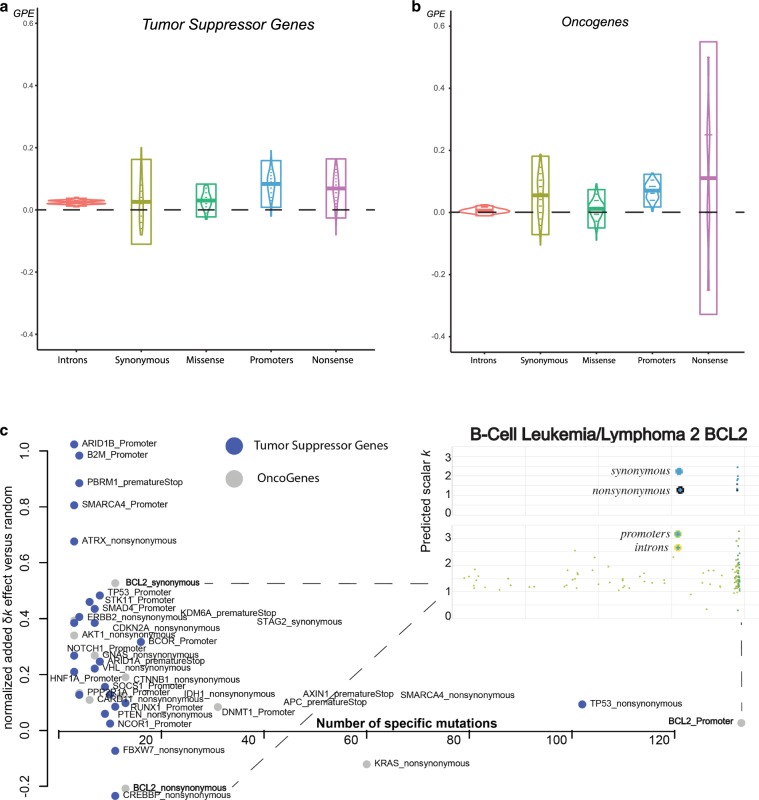
Fig. 4. Tumor-suppressor gene and oncogene elements show growth enrichment.
We show the positive growth enrichment across different mutation types (introns, synonymous, missense, nonsense, and promoters). For a, Vogelstein tumor suppressor genes and b Vogelstein oncogenes, boxplots represent 2 × σ deviation, lines represent the mean, while violin plots are trimmed to data range. In c, we plot gene elements (e.g., {GeneX_mutation type}) from Vogelstein gene list that showed significant positive or negative enrichment. We further zoom in to BCL2’s genomic region to map missense, nonsynonymous, promoter, and intronic mutations.

