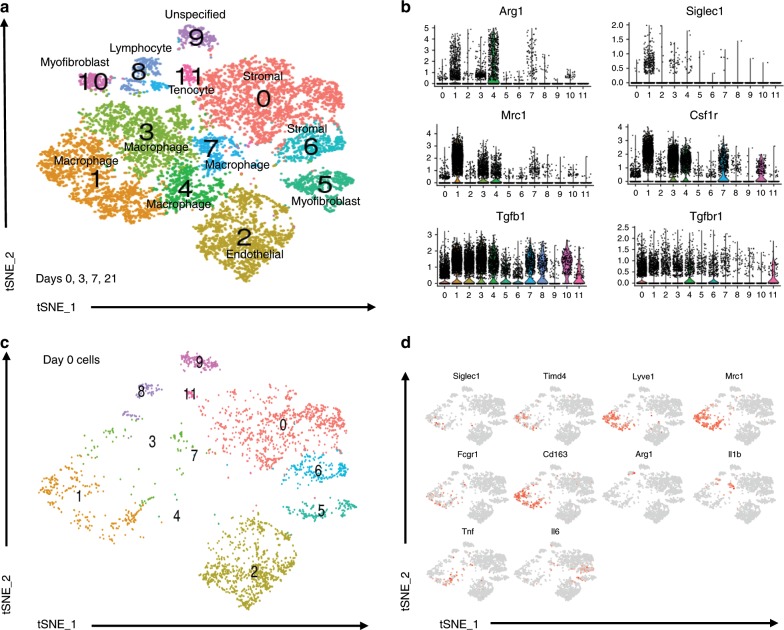
Fig. 4. Single cell RNA sequencing reveal multiple monocyte and macrophage clusters during trauma induced HO.
a Day 0, 3, 7, and 21 combined canonical correlation analysis and T-distributed stochastic neighbor embedding (t-SNE) plot identified 12 distinct cell clusters based on gene expression differences. b Violin plots of monocyte/macrophage markers (Siglec1, Arg1, Mrc1, Csfr1), Tgfb1, and Tgfbr1. c t-SNE plot displaying only those cells in the canonical correlation analysis from day 0. d Feature plots of monocyte/macrophage genes expressed to identify possible resident macrophages at the extremity injury site from day 0 cells.

