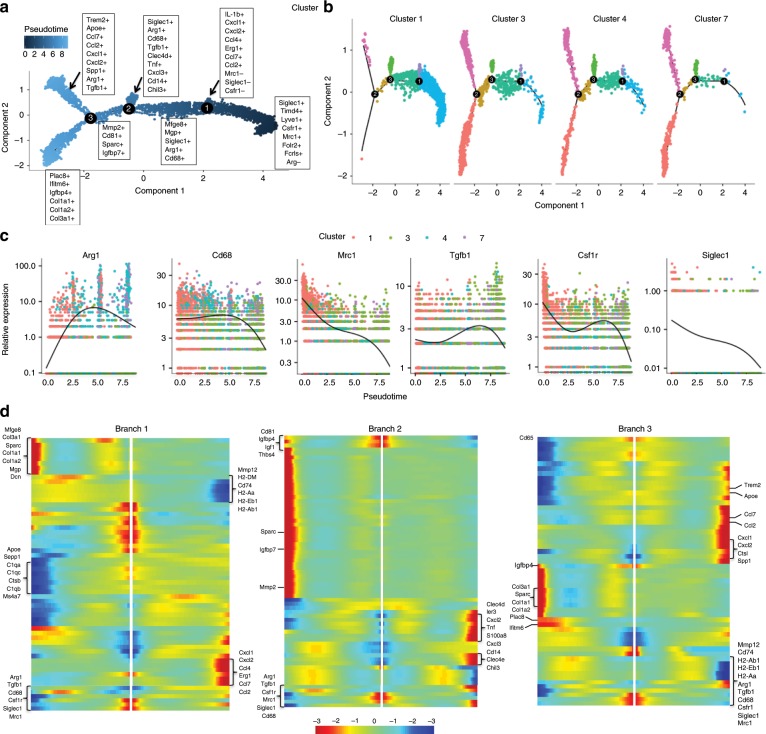
Fig. 5. Trajectory analysis of monocyte and macrophages from scRNA occupy differential activation states.
a Focused Monocle pseudotime trajectory analysis including only the monocyte/macrophage defined clusters 1, 3, 4, and 7 from Fig. 4a. b Monocyte/ macrophage clusters superimposed on pseudotime branches. c Cluster-defined gene expression plotted as a function of pseudotime. d Heatmaps of differentially expressed genes ordered based on their common kinetics through pseudotime displayed at each trajectory branch point as defined in our Monocle trajectory analysis of the monocyte/macrophage clusters (5a).

