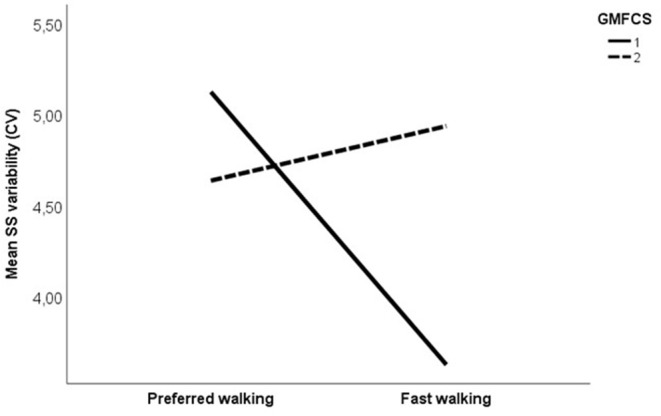
Figure 4.

Mean single support phase variability, expressed with coefficient of variation (%) at preferred and fast walking speed for GMFCS (Gross motor Function Classification System) level I (solid line) vs. GMFCS level II (dotted line). Corresponding data for typically developing children were 3.35% at preferred walking and 3.05% at fast walking.
