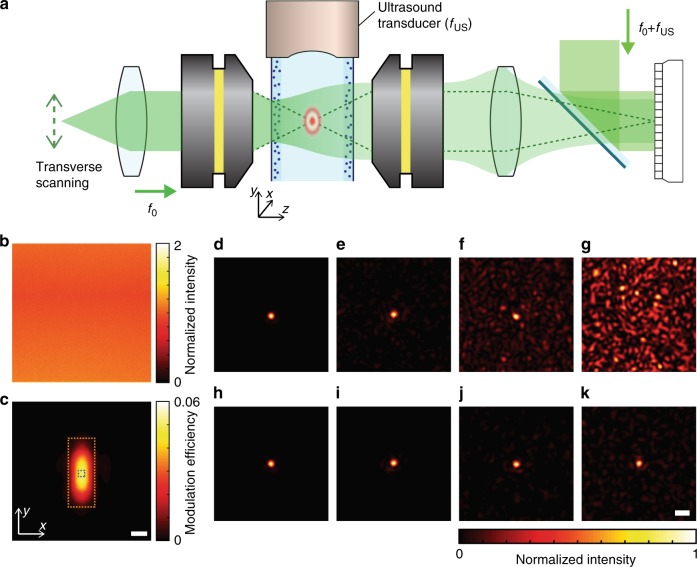
Fig. 2. Confocal imaging setup with acousto-optic space gating.
a Focused acoustic beam modulates the frequency of the incident focused illumination beam, whose optical frequency is f0. Only the frequency-modulated wave through the region of the space gating (i.e., acoustic focus) is measured at the sensor plane by using a phase-shifting interferometry, where the frequency of the reference beam is set to that of the acoustically modulated optical wave f0 + fUS. b Average intensity map for 900 planar illuminations at different incidence angles through a transparent medium without space gating. The entire object plane contributes to the detected signal. The intensity map is normalized to the mean intensity. c Same as b, but with space gating. With the space gating, only the region inside the gating window (i.e., the acoustic focus) contributes to the detected signal. The intensity map was normalized such that it represents the acoustic modulation efficiency. Scale bar: 30 μm. d–g Point spread functions (PSFs) |E(rd; ri)|2 measured on the detection plane without space gating, when the optical thicknesses of the input and output layers were (0, 0), (6.9, 10.6), (6.9, 12.8), and (10.6, 12.8), respectively. h–k PSFs |ESG(rd; ri)|2 with space gating for the corresponding scattering layers to d–g. PSFs were normalized to their maximum intensities. Scale bar: 5 µm.

