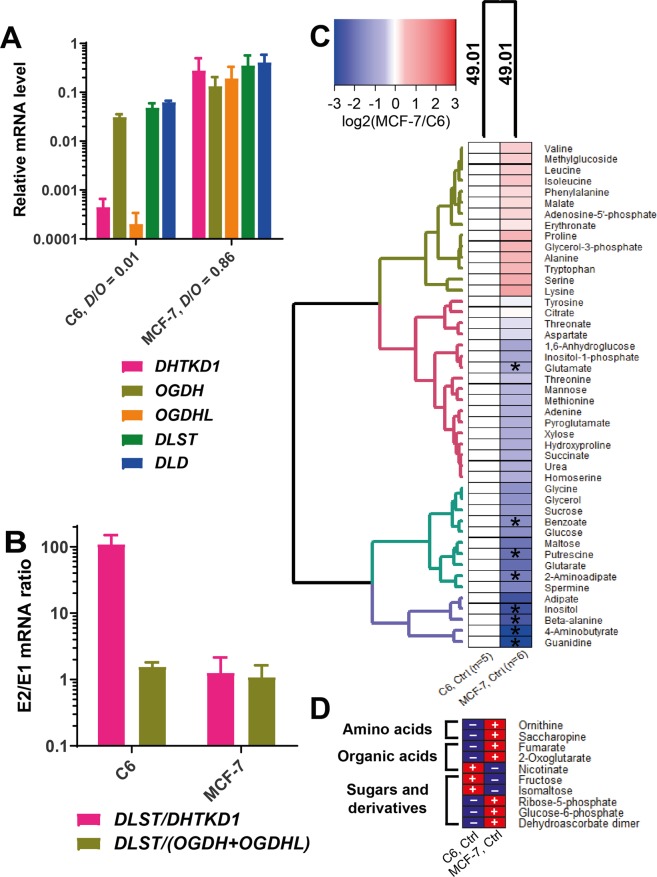
Figure 5.
Cellular metabolomes at different expression of the OGDHC and OADHC components. (A) Relative mRNA levels for the enzymatic components of OGDHC and OADHC in C6 and MCF-7 cell lines. The shown transcript abundances are averaged from ≥8 independent experiments for each cell line. D/O is the ratio between the expression of DHTKD1 and OGDH + OGDHL mRNAs. (B) Ratios of mRNA levels for the second and the first components of OADHC and OGDHC. (C) Relative metabolite abundances in the MCF-7 cell line compared to the C6 cell line. The asterisks show significant differences between the cell lines according to t-test. Experimental groups and metabolites are clustered using Manhattan as a distance measure and WPGMA as an agglomeration method. Number of independent experiments for each experimental group (n) is indicated at the bottom of the heatmap. (D) Cell-specific metabolites, i.e. those which are reliably quantified only in one of the two cell lines, are marked by “+” in the cell line where they are detected, and by “−” in the another one.

