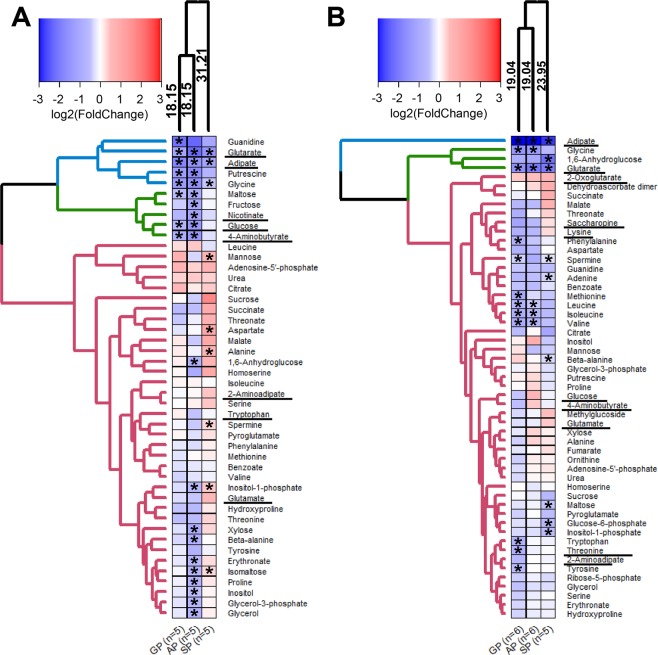
Figure 7.
Effects of SP, GP and AP on cellular metabolomes. Metabolic perturbations in the C6 (A) and MCF-7 (B) cell lines after a 5 h incubation of the cells in minimal medium with succinyl phosphonate (SP), glutaryl phosphonate (GP) or adipoyl phosphonate (AP) (0.5 mM each) are shown as log2 of fold changes compared to the non-treated cells of the same batch. Clustering of experimental groups and metabolites uses Manhattan as a distance measure and WPGMA as an agglomeration method. Number of independent experiments for each experimental group (n) is indicated at the bottom of the heatmaps. The asterisks show significant (p ≤ 0.05) differences between the treated and non-treated cells according to t-test. The metabolites of the pathways discussed in the text, are underlined.

