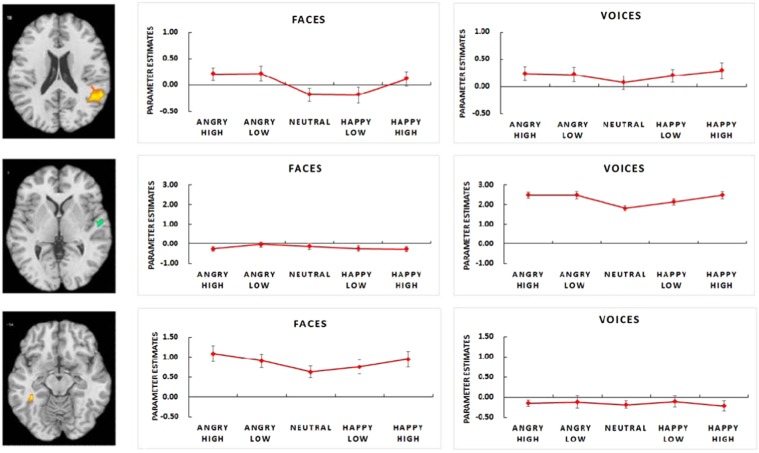
Figure 3.
Significant activation cluster in posterior superior temporal sulcus (x = 48, y = −53, z = 18) as revealed by arousal contrast weights and significant activation clusters in medial superior temporal sulcus (x = 54, y = −16, z = 6) and fusiform gyrus (x = −39, y = −40, z = −8) as revealed by arousal × modality interaction contrast. Bar plots represent parameter estimates for arousal-driven effects in SMG, mSTS, and FG. Parameter estimates refer to peak voxels, error bars indicate standard errors.

