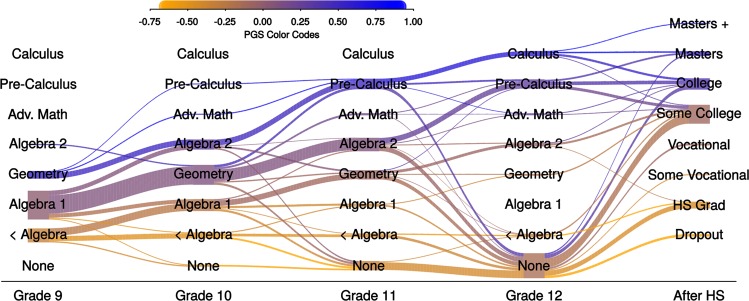
Fig. 3. Student DNA can be used to visualize the flow of students through the high school math curriculum.
Columns represent year of secondary school; rows represent mathematics course sequence ranging from least to most advanced. Width of the rivers connecting columns proportional to number of students. Shading of rivers represents the average education polygenic score for students in a particular course in a particular year, ranging from low (orange) to high (blue).

