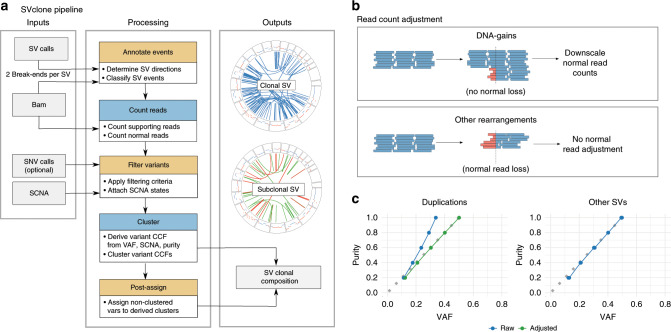
Fig. 1. Pipeline schematic and VAF calculation adjustment.
a A flow-chart of the SVclone pipeline. b A schematic showing the adjustments required for DNA-gains (top) and all other rearrangements (bottom). From left to right, each segment shows an unaffected locus, the effect of the variant type on reads at the breakpoint, and the resulting adjustment strategy required to normalise the allele frequency. Red portions of the reads show soft-clips, i.e. the portion of the reads mapping to the other end of the breakpoint. c The effect of adjusting raw VAFs in duplications (left), and unadjusted VAFs for other SVs (right), at purity levels at 20–100% in 20% increments, where the expected VAF is half the purity level (dotted line).

