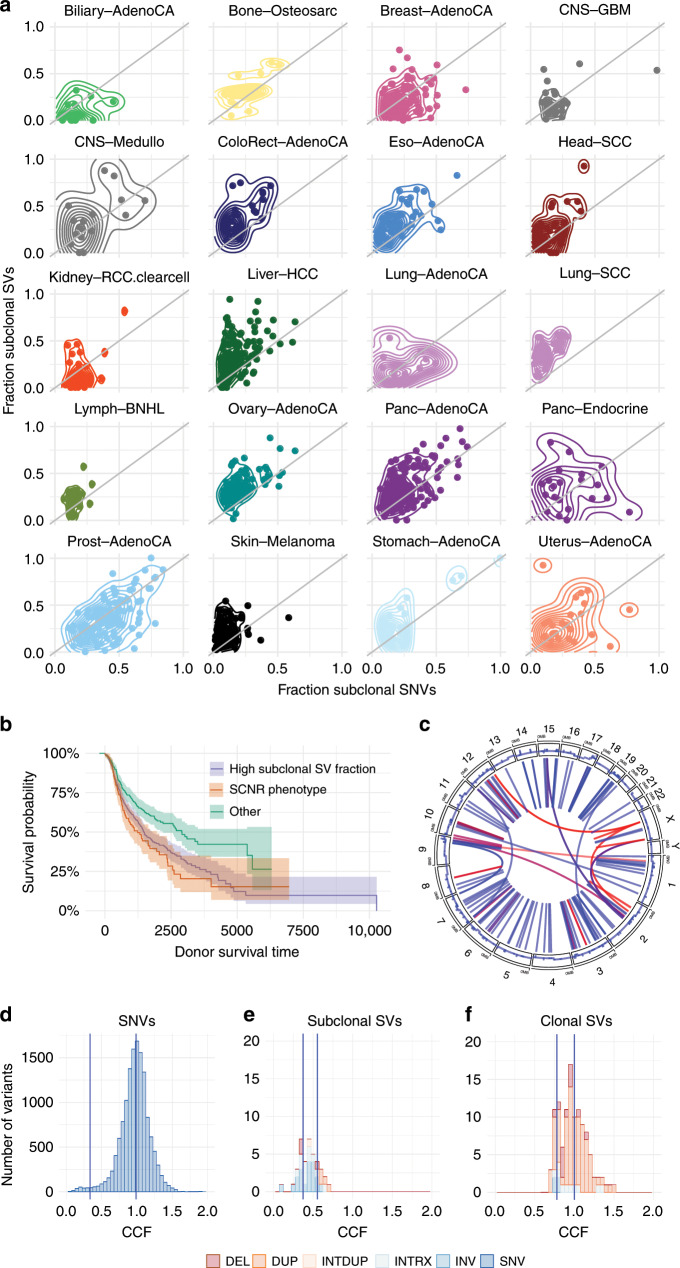
Fig. 6. Application of SVclone to PCAWG cohort.
a A 2D density plot of the fraction of subclonal SVs versus SNVs for PCAWG samples (n = 1169) (a variant under 0.7 CCF was considered subclonal). b Survival curves representing patients divided into those with a SCNR pattern, those with high subclonal SV fraction, or neither. c A circos plots for an example SCNR pattern tumour (Liver Hepatocellular carcinoma, tumour WGS aliquot 2bff30d5-be79-4686-8164-7a7d9619d3c0). The outside track represents the copy number across the genome and the inner lines indicate SVs. Blue lines represent clonal SVs and red lines represent subclonal SVs. d A CCF histogram of sample 2bff30d5-be79-4686-8164-7a7d9619d3c0’s SNVs. e A CCF histogram of 2bff30d5-be79-4686-8164-7a7d9619d3c0’s subclonal SV’s colour coded by SV category. f A CCF histogram of 2bff30d5-be79-4686-8164-7a7d9619d3c0’s clonal SVs.

