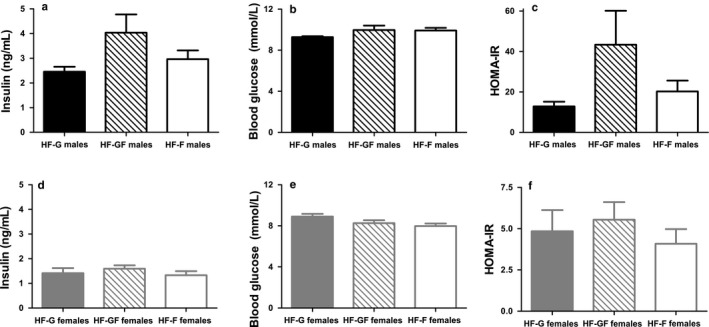
Figure 3.

Plasma insulin, blood glucose, and HOMA ‐IR. Plasma insulin concentrations in male (a) and female (d) mice, blood glucose concentrations in males (b) and females (e), and HOMA‐IR in males (c) and females (f). Solid bars represent HF‐G diet, striped bars represent HF‐GF, and white bars represent HF‐F. Values are expressed as mean ± SEM, n = 10 or n = 8 (HF‐G males insulin and HF‐G males HOMA‐IR)
