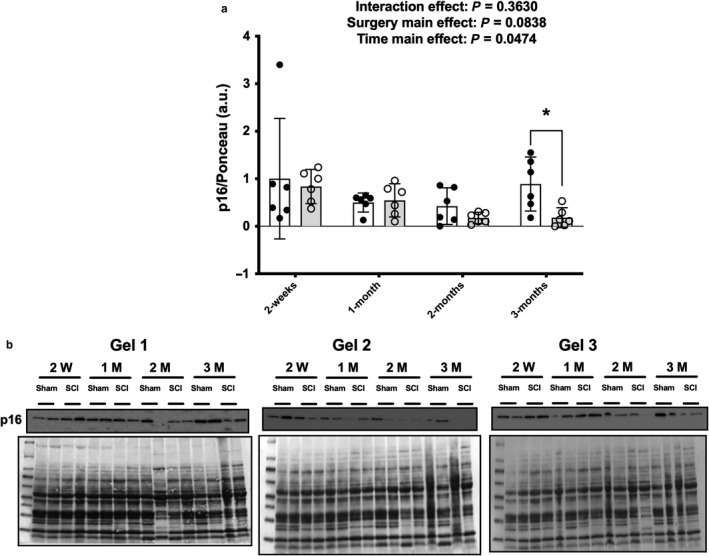
Figure 3.

Total protein expression of p16 (a) from the rat soleus at select timepoints after contusion SCI or Sham surgeries. Immunoblots and Ponceau S stains (b) for each individual sample used for the study. Key group differences between Sham and SCI animals are reported at each respective timepoint and * denotes p < .05. Data are presented as means ± 95% confidence intervals
