
Figure 2.
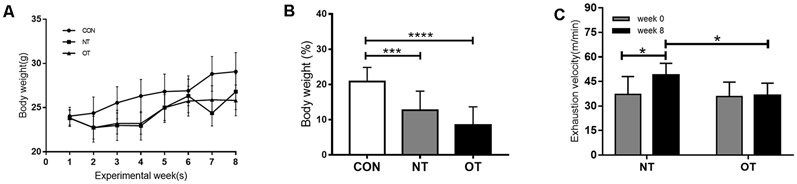
Bodyweight (g) responses in the experimental groups during the experimental weeks (A). The percentage of body weight change between week 0 and week 8 in the experimental groups (B). The effects of NT and OT group on the exhaustion velocity (EV), as determined during the ILT during weeks 0 and 8 (C). The data represent the means ± SE of n = 15. CON: sedentary mice; NT: mice trained with adequate recovery; OT: mice that underwent the downhill running OT protocol. *Statistical significance (P < 0.05); ***statistical significance (P < 0.001); ****statistical significance (P < 0.0001).