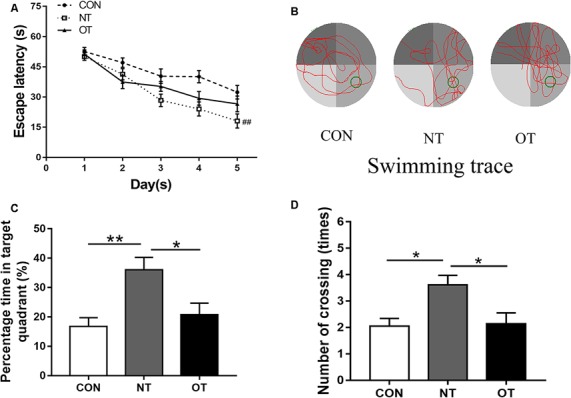
Figure 3.

The Morris water maze test results in the three experimental groups. The escape latency of the experimental groups (A). Representative samples of swimming trace during the probe test phase on day 6 (B). The percentage time in target quadrant (C) and the number of crossing (D) during probe testing. The data represent the means ± SE of n = 15. CON: sedentary mice; NT: mice trained with adequate recovery; OT: mice that underwent the downhill running OT protocol. *Statistical significance (P < 0.05); **statistical significance (P < 0.01); ##statistical significance (P < 0.01) compared with the CON group on the 4th and 5th day.
