
Figure 6.
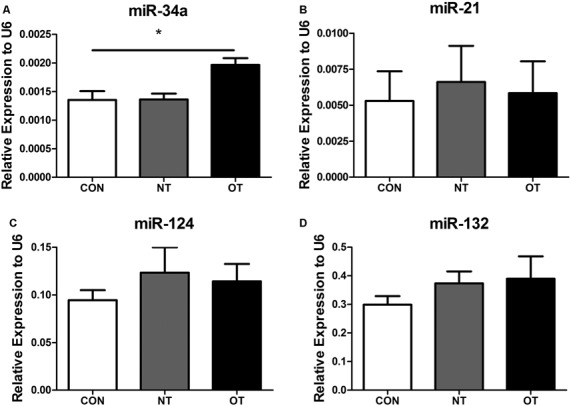
Expression of miR-34a (A), miR-21 (B), miR-124 (C) and miR-132 (D) in the hippocampus of the three experimental groups. The data represent to means ± SE of n = 15. CON: sedentary mice; NT: mice trained with adequate recovery; OT: mice that underwent the downhill running OT protocol. *Statistical significance (P < 0.05).