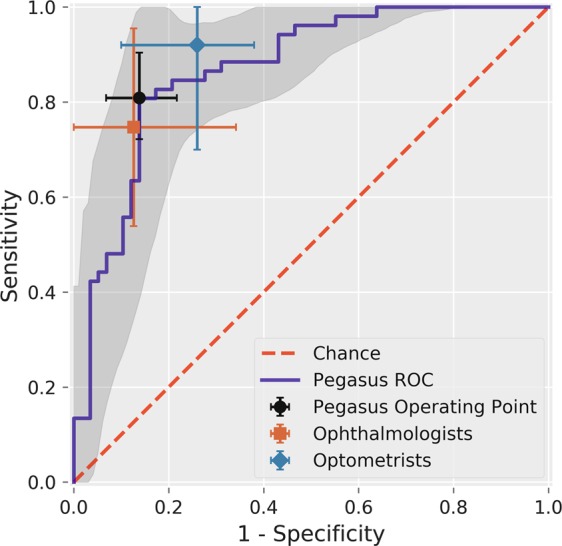
Fig. 3.

Receiver Operating Characteristic (ROC) curve for Pegasus. The shaded region indicates the 95% confidence interval on the Pegasus ROC estimated using bootstrap sampling with 1000 replications. The average performance and 95% confidence intervals for ophthalmologists (square), optometrists (diamond) and the Pegasus operating point (circle) are plotted
