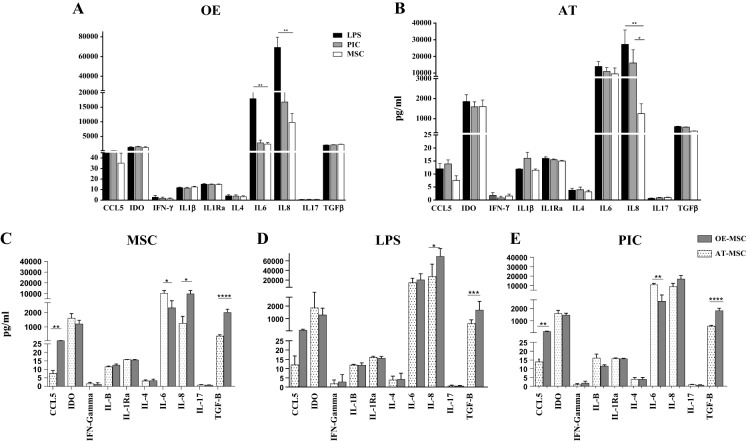
Fig. 5.
OE-MSCs and AT-MSCs have different patterns of cytokine production. a, b Data demonstrate the effect of LPS and PIC on cytokine secretion of AT-MSC and OE-MSC separately. c–e Data present the comparison of cytokine secretion in OE-MSCs and AT-MSCs media before and after LPS and PIC treatment. MSCs were pre-treated for 1 h with LPS or Poly(I:C), washed and cultured for an additional 48 h prior to harvesting the spent medium and analyzed with ELISA kits following the manufacturer’s instructions. Error bars indicate SEM. Data shown represent mean ± SE of MSCs from 8 donners. *p < 0.05; **p < 0.01; ***p < 0.001; ****p < 0.0001. LPS lipopolysaccharide, PIC polyinosinic:polycytidylic acid

