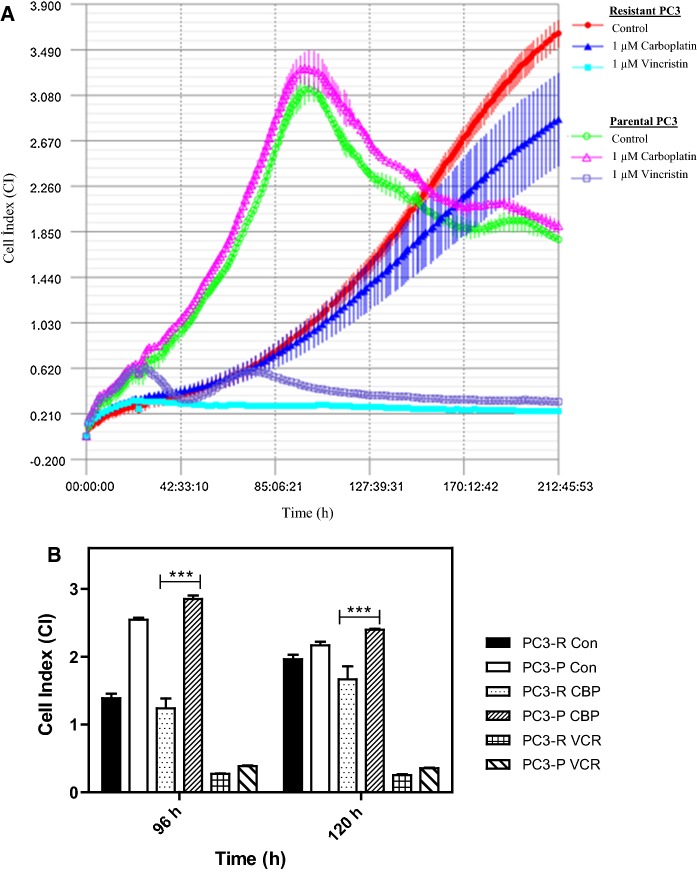
Fig. 3.
Effect of carboplatin (1 µM) and vincristine sulfate (1 µM) on parental PC3 and resistant PC3 cells. a The cell proliferation was determined by the iCELLigence system. b The statistical analysis of cell index values for each treatment. The results are presented as mean ± SD. The groups were compared with two-way ANOVA with Bonferroni multiple comparison post-test. ** represents a p-value < 0.01; *** represents a p-value < 0.001

