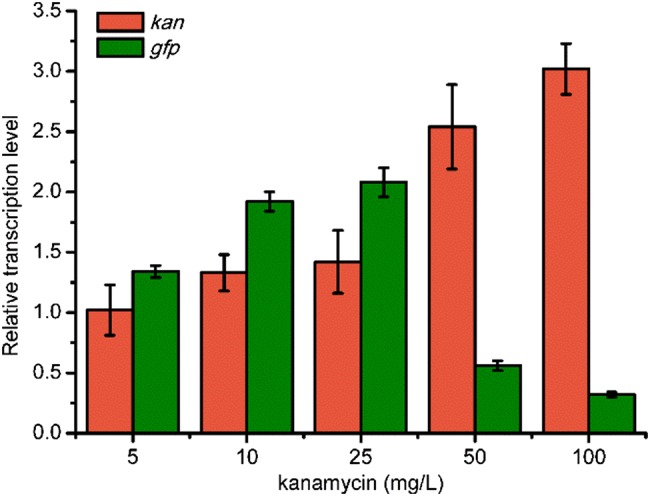
Fig. 3.

Relative transcription level of gfp and kan in E. coli JZ-1 with different concentrations of kanamycin. E. coli JZ-1 with no kanamycin added was selected as the control. The rrsG transcripts were selected as the standard and each measurement was repeated three times. The error bars indicate standard deviations from three replicate samples
