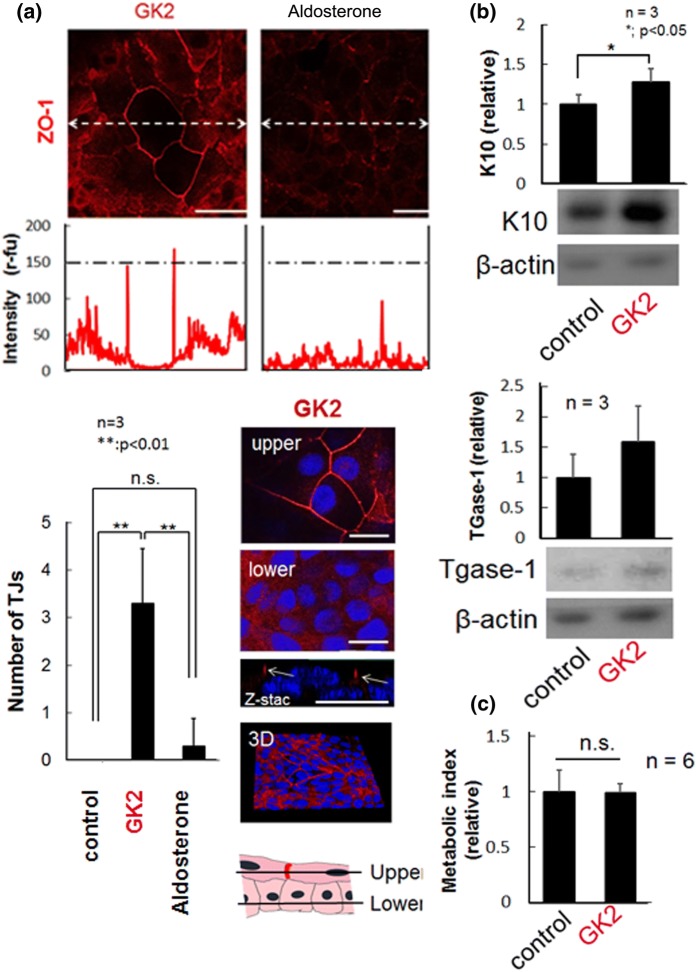
Fig. 3.
Induction of TJ formation by GK2 in HaCaT cells. a On day 1, the upper, TJ protein ZO-1 (red) was immunostained in cells treated with GK2 (30 μM) or aldosterone (1 μM). Central portion of the photographs were line scanned (dotted lines) and the signal intensities were plotted. Scale bars, 50 μm. Lower left, total number of TJs on 600 μm scanned line (200 μm × 3 lines) from each cell image. Lower right, a representative confocal image of cells treated with GK2. Images from upper (9 μm from culture dish) and lower (4.5 μm from culture dish) planes, and that of Z-stack were shown. Arrows, accumulation of ZO-1 at cell–cell contact sites only in the stratified upper layer. Scale bars, 25 μm. b Western blot analyses of Keratin 10 (K10) and TGase-1. Cells treated with GK2 significantly up-regulated K10 and tend to increase TGase-1. Experiments were repeated three times and the representative blot data were shown. c Relative cell viability measured with Alamar-blue reagent. While the experiments were repeated six times, cytostatic or toxic effect was not detected in GK2

