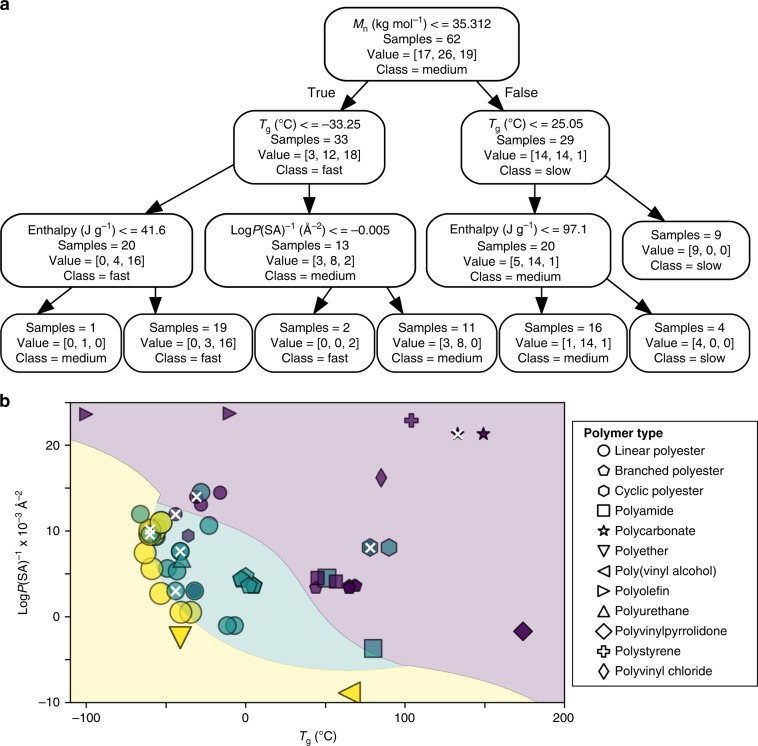
Fig. 5. Machine learning results with 3-levels of classification.
a Decision tree based on molecular weight, enthalpy, LogP(SA)−1, and Tg. Within each box of the tree, value = [x, y, z] corresponds to [slow, medium, fast]. b Graphical representation of two of the four features. The shaded areas, added to visually generalize the degradation regions, correspond to fast (yellow), medium (green), and slow (purple) degradation. Incorrect predictions from the classification tree are denoted with an ‘x’.

