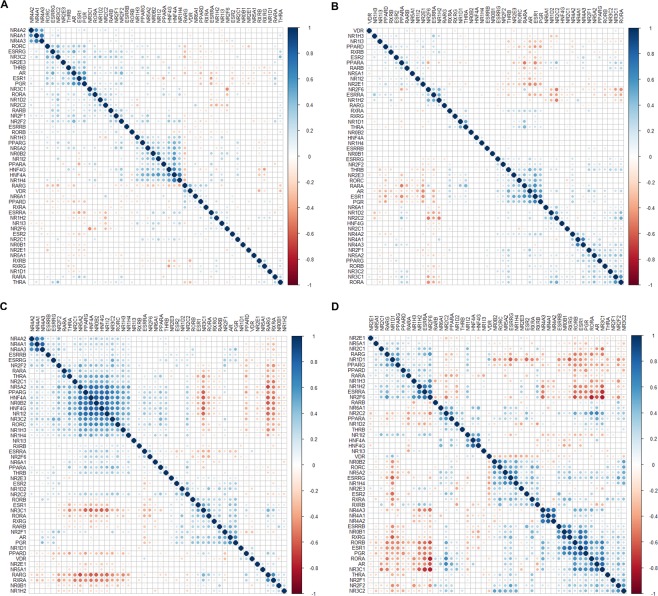
Figure 4.
Pairwise Pearson correlation plots between NR gene expression in different ‘Pan-Cancer’ diseases. Correlation matrices for (A) the 21 ‘Pan-Cancer’ diseases, (B) BRCA, (C) ESCA, and (D) PAAD, with genes ordered using hierarchical clustering with the Ward’s minimum variance method (Ward.D2). Positive correlation coefficients are displayed in blue and negative correlation coefficients in red color. The color intensity and circle size are proportional to the correlation coefficients (P < 0.05), while correlation coefficients with P > 0.05 are blank.

