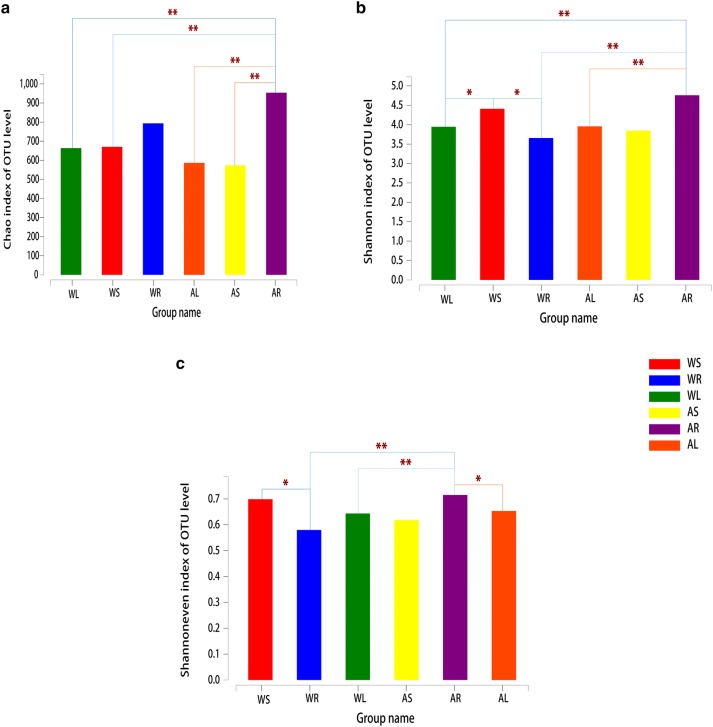
Fig. 3.
Alpha-diversity estimates of bacterial communities in different parts of wild-type (WT) and cultivated C. teeta plants. a OTU richness estimates (Chao index). b OTU diversity estimates (Shannon diversity index). c OTU evenness estimates (Shannon evenness index). WL, WS, and WR represent roots, stems, and leaves of wild-type plants, respectively. AL, AS, and AR represent roots, stems, and leaves of artificial cultivar, respectively. The chart shows significant differences between groups (*p < 0.05, **p < 0.01, and ***p < 0.001). The abscissa is the group name and the ordinate is the exponential average of index value for each group

