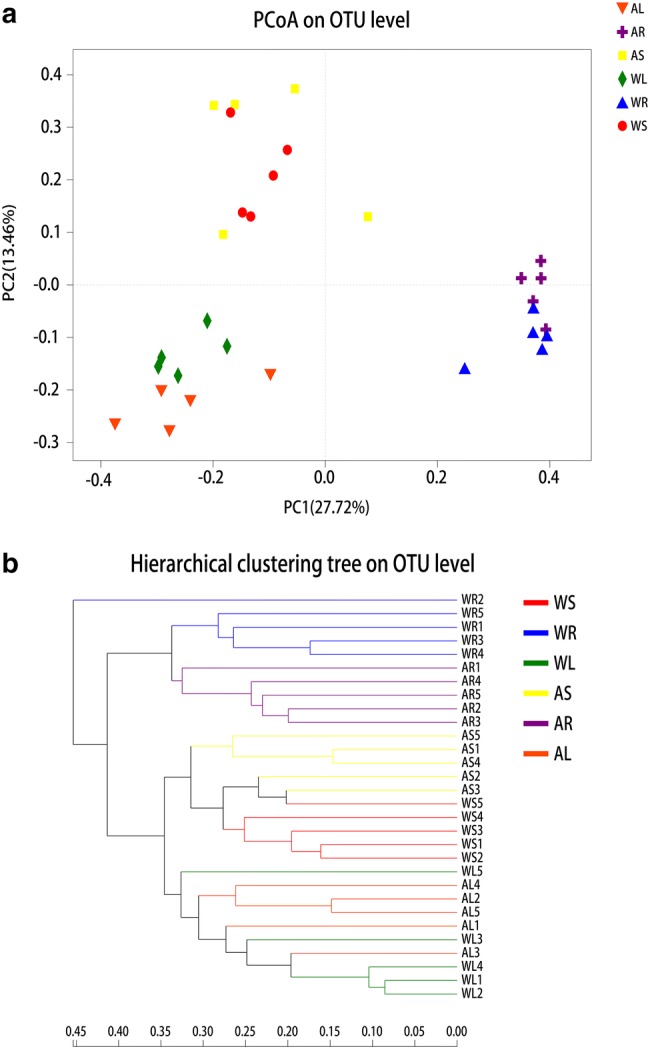
Fig. 4.

Beta-diversity estimates of bacterial communities in different parts of wild-type (WT) and cultivated C. teeta plants. a Principal component analysis at the OTU level. WL, WS, and WR represent roots, stems, and leaves of wild-type plants, respectively. AL, AS, and AR represent roots, stems, and leaves of artificial cultivar, respectively. Horizontal and vertical coordinates represent two selected principal coordinate components, and the percentage represents the contribution of the principal coordinate component to community composition differences. Different colored points and shapes represent samples from various groups, and the closer two sample points are, the more similar the composition of the two sample species. b Hierarchical clustering tree at the OTU level. The length of branches represents the distance between samples, and different groups are shown in different colors
