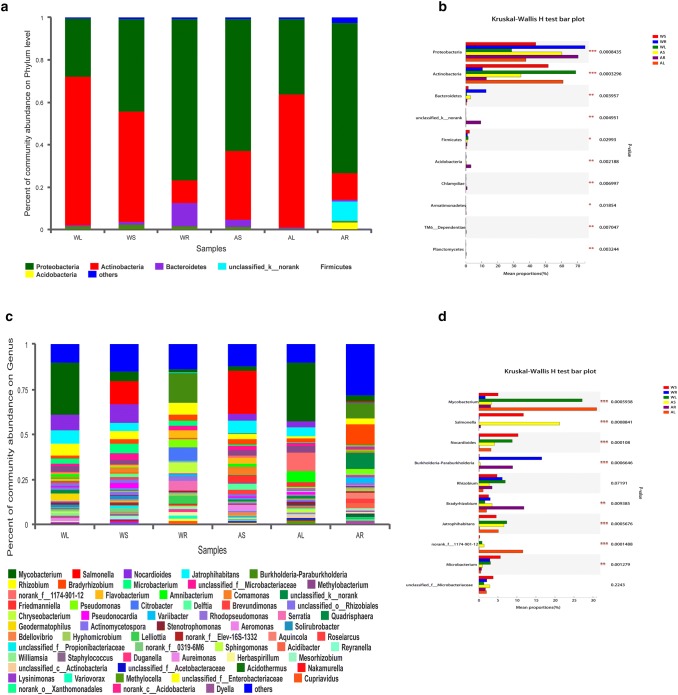
Fig. 5.
Distribution of bacterial OTUs at phylum and genus levels. a Percentage abundance at the phylum level. Different colored columns represent various species, and the length of columns represents the proportion of identified phyla. b The top 10 dominant phyla. The vertical axis represents the phylum name, and the column length corresponding to the phylum represents its average relative abundance in each sample group, with different colors indicating various groupings. The p-value is shown in the right (*p < 0.05, **p < 0.01, and ***p < 0.001). c Percentage abundance at the genus level. Different colored columns represent various genera, and the length of columns represents the proportion of identified genera. d The top 10 dominant genera. The vertical axis represents the genus name, and the column length corresponding to the genus represents its average relative abundance in each sample group, with different colors indicating various groupings. The p-value is shown on the right (*p < 0.05, **p < 0.01, and ***p < 0.001)

