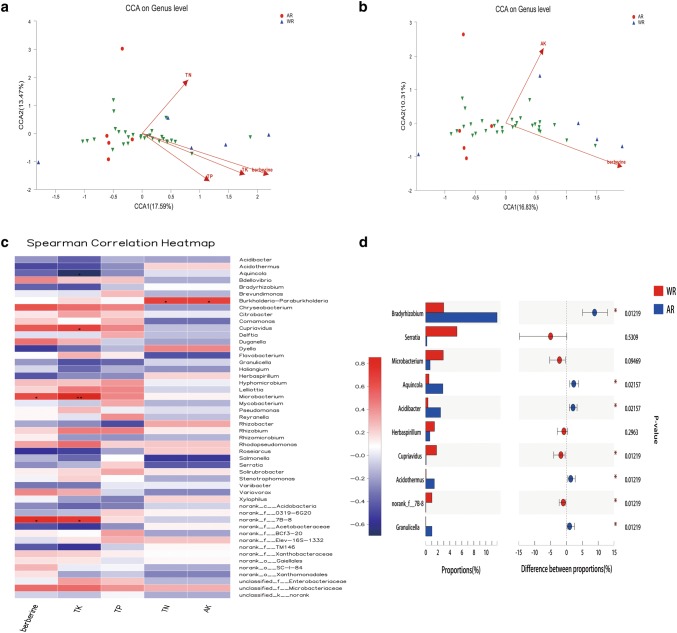
Fig. 6.
Correlations between berberine synthesis, endophytic bacteria, and soil environment. a Canonical correspondence analysis (CCA) at the genus level (1). b CCA at the genus level (2). Different colored dots and shapes represent sample groups, green arrows represent bacterial genera, red arrows represent environmental factors, and the length of environmental factors arrows represents the extent to which these factors affect the genus data. The angle between s environmental factors arrows represents the correlation (sharp angle = positive correlation, obtuse angle = negative correlation, and right angle = no correlation). c Spearman correlation heatmap. The x- and y-axes are environmental factors and bacterial genera, respectively. R values are shown in different colors, p values < 0.05 are labeled with an asterisk (*), and the legend on the right shows color intervals for different R values (*p < 0.05, **p < 0.01, and ***p < 0.001). d The top 10 related genera. The vertical axis represents the genus name, and the column length corresponding to the genus represents its average relative abundance of the genus in each sample group, with different colors indicating various groupings. The p value is shown on the right (*p < 0.05, **p < 0.01, and ***p < 0.001)

