Figure 4.
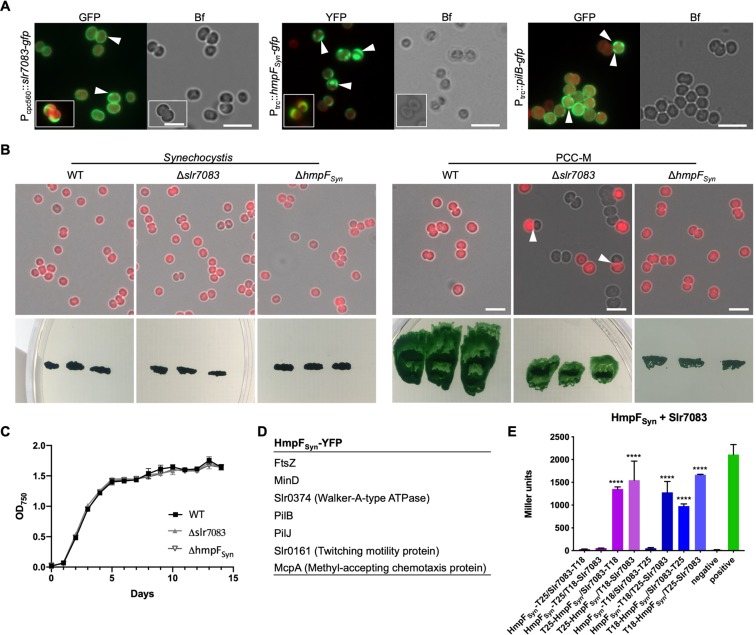
Slr7083 and HmpFSyn are involved in twitching motility in Synechocystis. (A) Merged GFP fluorescence and chlorophyll autofluorescence (red) and bright field micrographs of Synechocystis cells expressing, Slr7083-GFP, HmpFSyn-YFP or PilB-GFP from Pcpc560 (Slr7083) or Ptrc (HmpFSyn, PilB). Expression of PilB-GFP in PCC-M resulted in the same localization pattern (data not shown). White triangles indicate focal spots and crescent-like formations. Scale bars: 5 μm. (B) Merged bright field and chlorophyll autofluorescence micrographs of motile and non-motile Synechocystis WT, Δslr7083 and ΔhmpFSyn mutant cells. Below, motility tests of three single colonies from indicated cells streaked on BG11 plates and illuminated from only one direction are shown. (C) Growth curve of Synechocystis WT, Δslr7083 and ΔhmpFSyn mutant strains grown in quadruples at standard growth conditions. OD750 values were recorded once a day for 15 d. Error bars show the standard deviation (n = 4). (D) Excerpt of interacting proteins of interest from mass spectrometry analysis of anti-GFP co-immunoprecipitations of Synechocystis cells expressing HmpFSyn-YFP from Ptrc. (E) Beta-galactosidase assays of E. coli cells co-expressing indicated translational fusion constructs of all possible pair-wise combinations of Slr7083 with HmpFSyn grown for 1 d at 30 °C. Quantity values are given in Miller Units per milligram LacZ of the mean results from three independent colonies. Error bars indicate standard deviations (n = 3). Neg: pKNT25 plasmid carrying hmpFSyn co-transformed with empty pUT18C. Pos: Zip/Zip control. Values indicated with * are significantly different from the negative control. *P < 0.05, **P < 0.01, ***P < 0.001, ****P < 0.0001 (Dunnett’s multiple comparison test and one-way ANOVA).

