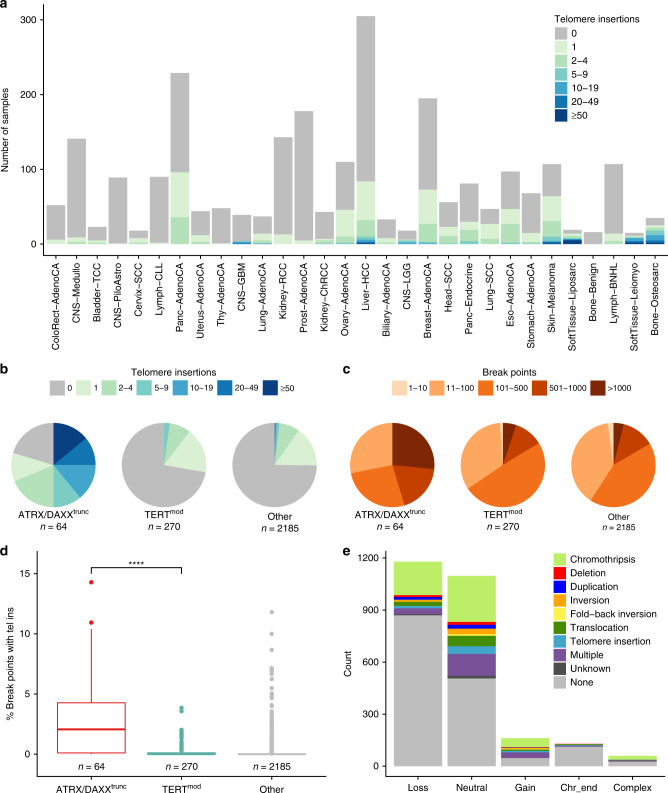
Fig. 3. Insertion of telomere sequences into nontelomeric chromosomal regions.
a Number of telomere insertions in samples of different tumor types. The tumor types are sorted by mean telomere content tumor/control log2 ratios. Cohorts with sample sizes <15 are not shown. b Number of telomere insertions in samples with different TMM-associated mutations. c Number of breakpoints in samples with different TMM-associated mutations. d Percent of breakpoints coinciding with telomere insertions in samples with different TMM-associated mutations. The center line of the boxplot is the median, the bounds of the box represent the first and third quartiles, the upper and lower whiskers extend from the hinge to the largest or smallest value, respectively, no further than 1.5 × IQR from the hinge (where IQR is the interquartile range, or distance between the first and third quartiles). ****p < 0.0001, Wilcoxon rank-sum test. e Copy number changes of adjacent segments accompanying telomere insertions. “Complex” means that the copy numbers between segments differ in more than four copies. Overlaps with regions of chromothripsis are indicated. For telomere insertions that did not overlap with regions of chromothripsis, structural variations, or additional telomere insertions within 10 kb are indicated.

