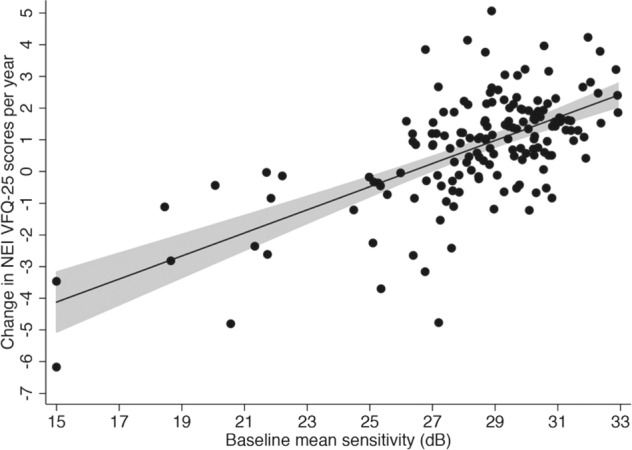
Fig. 4.

Scatterplot with fitted regression line showing the relationship between change in NEI VFQ-25 scores and baseline disease severity as measured by binocular mean sensitivity. The shaded area corresponds to the 95% confidence interval of the regression slope. dB decibel. Reproduced with permission from Medeiros et al. [94]
