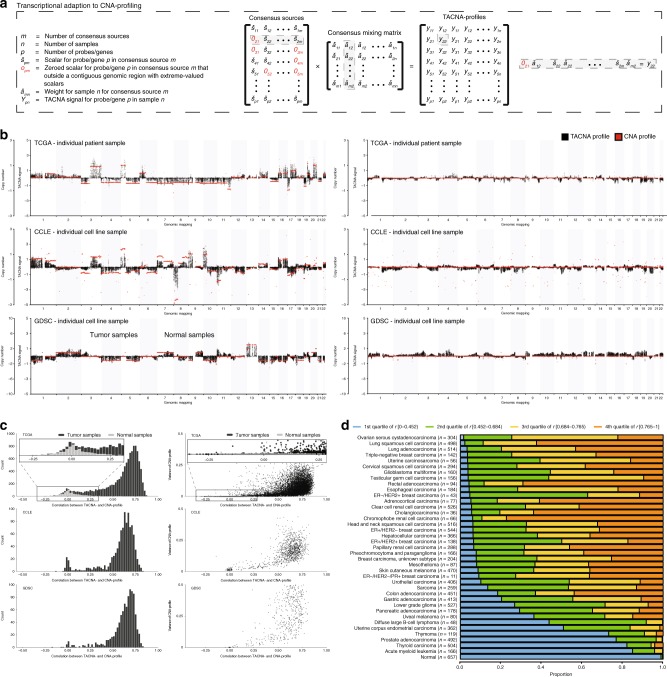
Fig. 2. Transcriptional adaptation to CNA profiling (TACNA profiling).
a Transcriptional adaptation to CNA (TACNA) profiling. For each dataset, weights of genes mapping to a contiguous genomic region in CNA-CESs marked by the detection algorithm were retained in the CES matrix. Weights of genes that mapped outside marked genomic regions were instead set to zero. Next, TACNA profiles were calculated as the product between this transformed CES matrix and the consensus mixing matrix. b Examples of TACNA profiles illustrating that the resulting patterns clearly matched those in their paired, independently generated CNA profiles. c Left panel: distribution of Pearson correlations between TACNA profiles and paired CNA profiles for the TCGA, CCLE, and GDSC datasets. Right panel: variance observed in CNA profiles versus the Pearson correlation between CNA profiles and paired TACNA profiles for the TCGA, CCLE, and GDSC datasets. d Quartiles distribution plot of Pearson correlations between TACNA profiles and paired CNA profiles, per tumor type in the TCGA dataset. ER: estrogen receptor; HER2: human epidermal growth factor receptor 2; PR: progesterone receptor.

