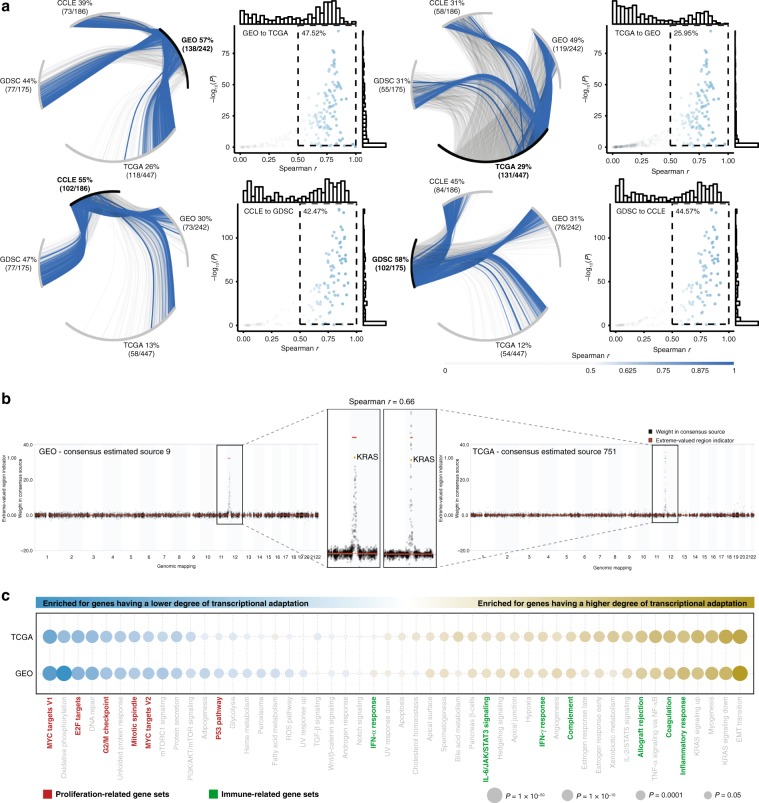
Fig. 3. Degree of transcriptional adaptation to CNAs.
a Citrus plots showing the Spearman correlations between CNA-CESs in the reference dataset, depicted in bold, with CNA-CESs in the other three datasets. Blue lines indicate r > 0.5. Correlations are calculated based on the weights of genes in marked genomic regions of the CNA-CESs under investigation. Each scatterplot with marginal histograms shows the correlations versus their −log10 transformed P values. The inset shows correlations > 0.5 having a P value < 0.05. b Example of a CNA-CESs in the GEO dataset that is highly correlated with a CNA-CES in the TCGA dataset with KRAS having a low degree of transcriptional adaptation to CNAs. Spearman correlation coefficient was derived using the genes mapping to the extreme-valued region from either of the CNA-CESs (n = 38). c Enrichment results using two-sided Welch’s t-test for the MSigDB Hallmark collection. A yellow bubble indicates enrichment for genes with a high degree of transcriptional adaptation to CNAs, and a blue bubble indicates a low degree. The size of the bubble corresponds to the significance level. Only CNA-CESs having at least 50 genes in their marked region were included. EMT: epithelial-mesenchymal transition; ROS: reactive oxygen species.

