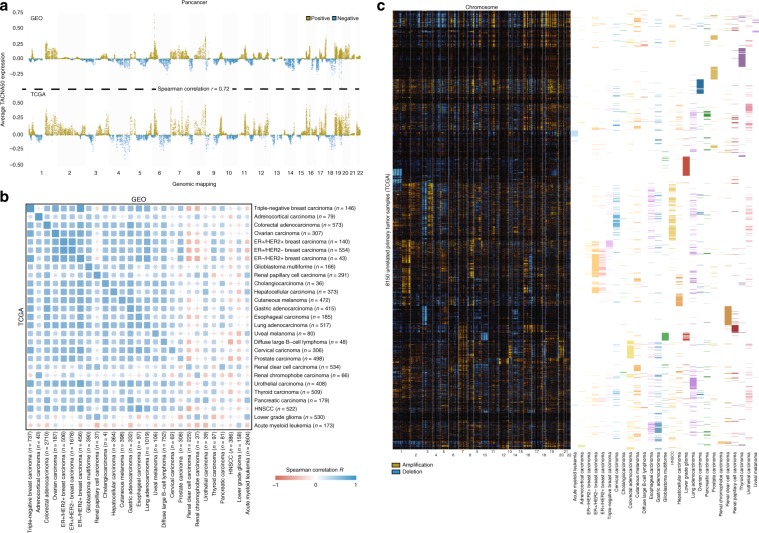
Fig. 5. The landscape of transcriptional effects of CNAs in a large set of cancer samples.
a Average pan-cancer TACNA profiles in GEO and TCGA dataset. Spearman correlation coefficient was derived using the 15,389 genes which were present in both datasets. b Distance matrix of Spearman correlations between average TACNA profiles in the GEO dataset and TCGA dataset for overlapping tumor types. The size and transparency of a square corresponds to the absolute correlation coefficient. HNSCC: head and neck squamous cell carcinoma. c Hierarchical clustering of the landscape of transcriptional effects of CNAs in the TCGA dataset for 8150 cancer samples of tumor types also present in the GEO dataset.

