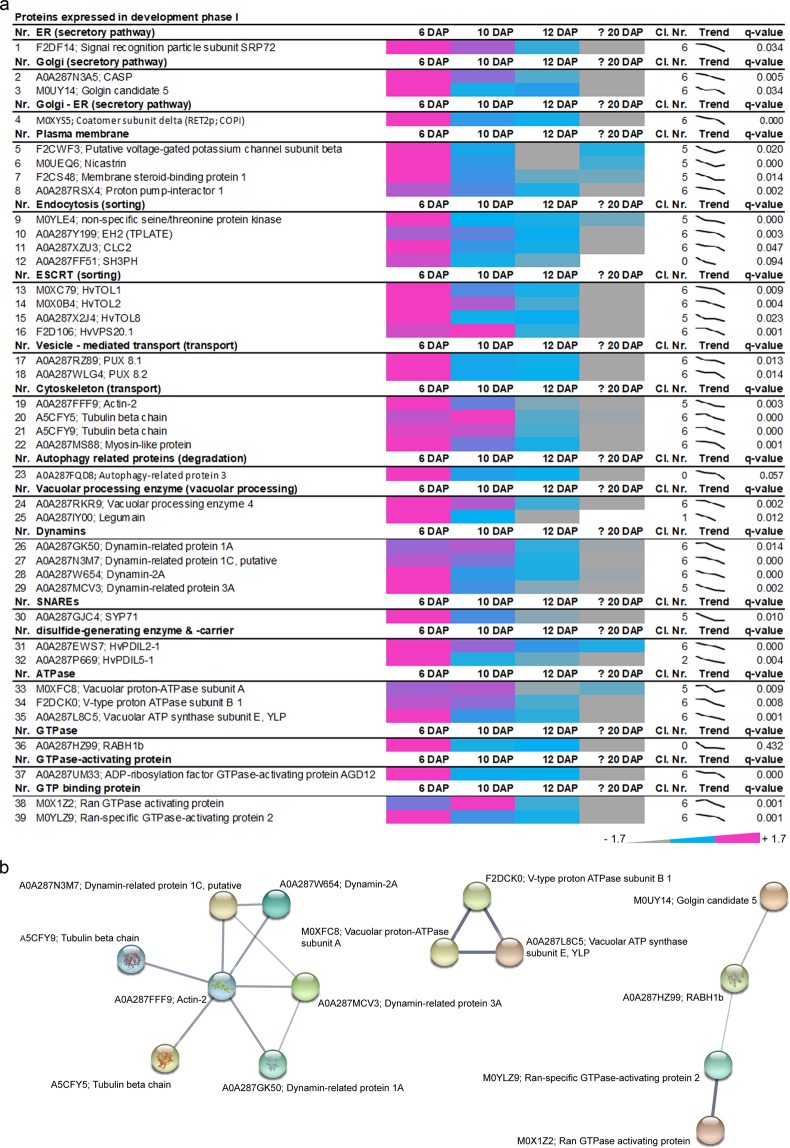
Figure 2.
Identification of proteins that are highly abundant at development phase I of developing barley grains. (a) Data-matrix heat map representing Z-score values of 6, 10, 12 and ≥20 DAP. Heat map was prepared using Microsoft Excel. Scale: grey = smallest value; blue = 50% quantile; pink = highest value. (b) Proteins present in this stage were analyzed using the STRING database. STRING default parameters were used25, protein names are indicated. PBs are identified in the bright field as small spherical structures as recently published13,15,16.

