Figure 6.
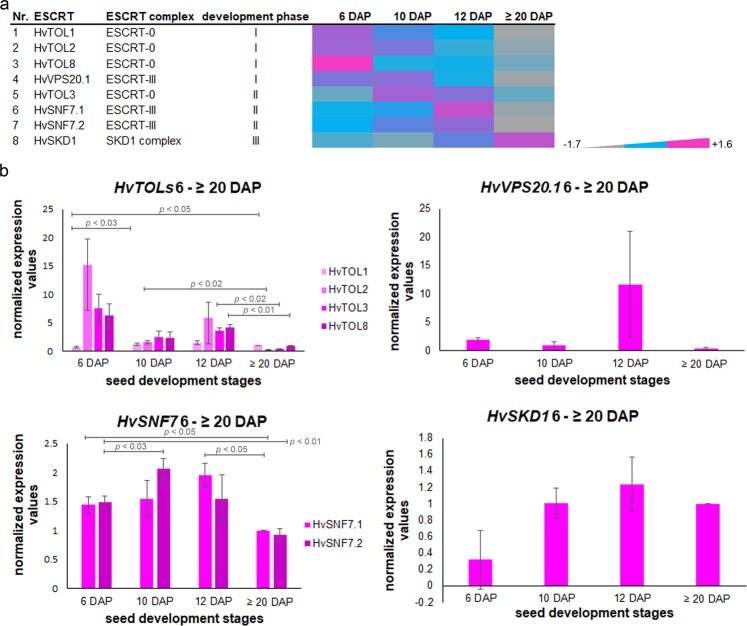
Temporal regulation of identified ESCRT proteins and transcripts. (a) Data-matrix heat map representing Z-score values of 6, 10, 12 and ≥20 DAP. Heat map was prepared using Microsoft Excel. Scale: grey = smallest value; blue = 50% quantile; pink = highest value. HvTOL1, HvTOL2, HvTOL8, and HvVPS20.1 show a high abundance at developmental phase I, but a continuous decrease over the development of barley grain. HvTOL3, HvSNF7.1, and HvSNF7.2 exhibit an expression peak during developmental phase II, while HvVPS4 continuously accumulated during the early grain development up to developmental phase III. (b) Temporal quantification of HvESCRT transcripts in developing barley grains. Bar graphs describe the average over three biological replicates of the normalized transcripts from HvTOL1/HvTOL2/HvTOL3/HvTOL8, HvVPS20.1, HvSNF7.1/HvSNF7.2 and HvSKD1 at 6, 10, 12 and ≥20 DAP. For statistical analyses we performed a Student’s t-test (n = 3). Bars represent standard deviation; p-values are indicated.

