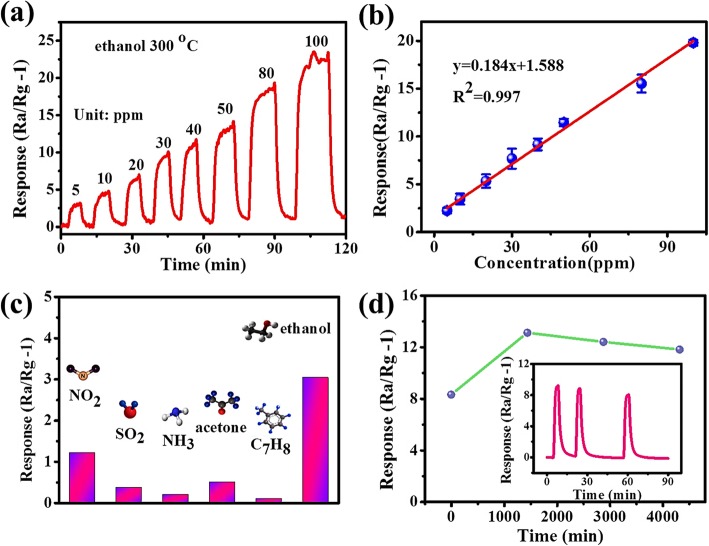
Fig. 7.
a Real-time response curve to different ethanol concentrations at 300 °C. b The response linear fitting curve as a function of the ethanol concentration at 300 °C. c Gas responses of cross-linked SnO2:NiO network to 5 ppm various target gases including NO2, SO2, NH3, acetone, C7H8, and ethanol. d The response stability of a typical SnO2/NiO network sensor continuously measured in 3 days to 50 ppm ethanol at 300 °C. The inset figure in (d) shows the response-recovery curve of the same sensor measured after 3 days

