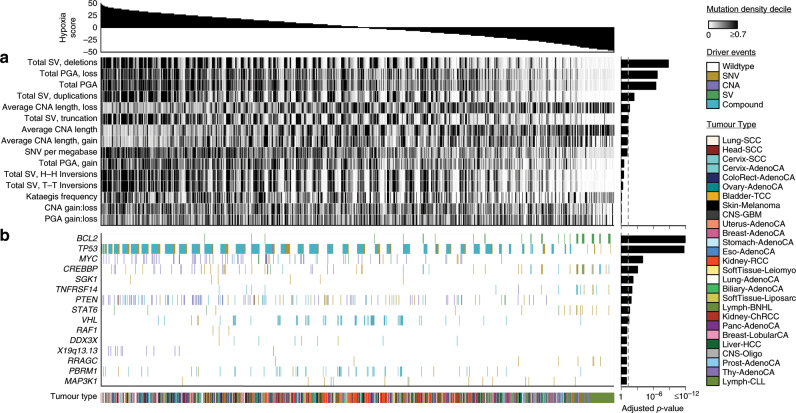
Fig. 2. The genomic correlates of tumour hypoxia.
We associated tumour hypoxia with mutational density and summary features, a, and driver mutations, b, across 27 cancer types using linear mixed-effect models. Hypoxia scores for all 1188 tumours are shown along the top. a Elevated tumour hypoxia was strongly associated with more deletions, elevated PGA, smaller CNAs, and a higher number of SNVs per megabase (n = 1188 independent tumours). Bonferroni-adjusted p-values are shown on the right. b We tested if driver mutations (e.g. any of SNV, CNA, SV or a compound event with more than one type of mutation) were associated with hypoxia in 1096 independent tumours with driver mutation data. Tumours with mutations in BCL2 showed lower levels of hypoxia while patients with mutations in TP53 showed remarkably elevated tumour hypoxia. Other driver mutations associated with elevated hypoxia include the oncogene MYC and the tumour suppressor PTEN. FDR-adjusted p-values are shown along the right. SV structural variant; PGA percentage of the genome with a copy-number aberration; CNA copy-number aberration; SNV single nucleotide variant; H-H head-to-head; T-T tail-to-tail. All associations were modelled using linear mixed-effect models while adjusting for cancer type, tumour purity, age and sex.

