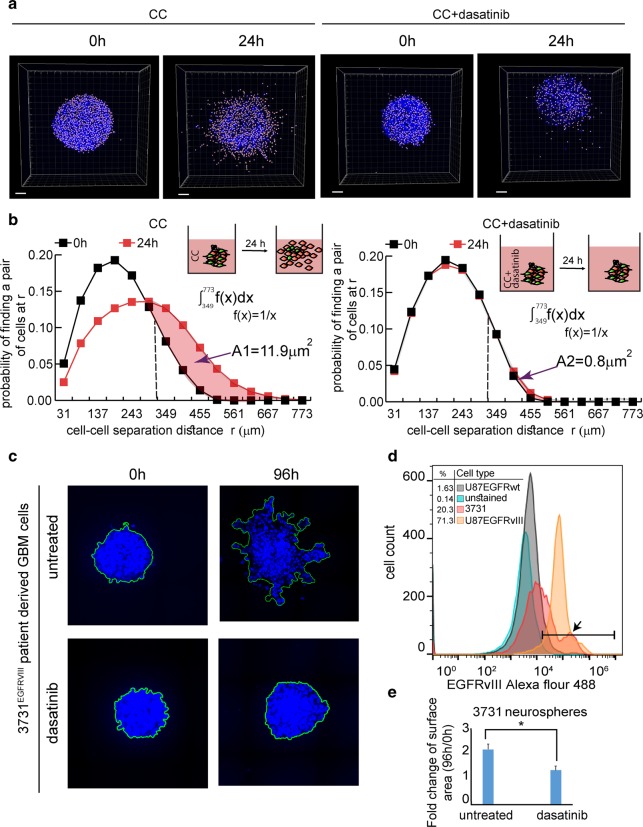
Fig. 7. Dasatinib inhibits the infiltrative properties of CC: EGFRwt + EGFRvIII and 3731EGFRvIII NS in 3D.
a, b CC NS were embedded in 40% Matrigel with or without treatment (200 nM dasatinib). a Treated and untreated NS were imaged at 0 h and after 24 h, scale bars represent 100 μm. b The probability of finding a pair of the cells at r (0–800 μm) was calculated at 0 and 24 h as described in Methods. Plots representing the distribution of cell–cell separation distances of treated and untreated CC are shown. The difference between cell–cell separation distance distributions of treated and untreated NS was quantified by calculating the area of shift towards longer cell–cell separations, as shown in the figure. The area indicates the displacement of the distribution between two time points. A large area indicates higher cell spreading. The average area was calculated using four NS for each condition. P value = 0.02 between A1 and A2. c, d The percentage of cells harboring EGFRvIII in the patient-derived 3731 neurospheres was examined using flow cytometry analysis. d The histogram indicates the percentage of cells expressing EGFRvIII: U87EGFRwt (1.63%), U87EGFRvIII (71.3%) and 3731 patient-derived GBM cells (20.3%) (indicated with black arrow). c 3731 neurospheres were embedded in 40% Matrigel with or without treatment (200 nM dasatinib). Cell spreading was examined for up to 96 h. e To quantify neurospheres’ dispersion (which grow as compact structures preventing from the software to resolve clearly single nuclei) 3D neurospheres images were converted similarly to the maximum intensity projection algorithm, namely by projecting 3D structures on 2D surface. The area of each neurosphere between 96 h and 0 h was calculated. n = 14 NS for each condition (from two independent experiments). *P value = 0.01.

