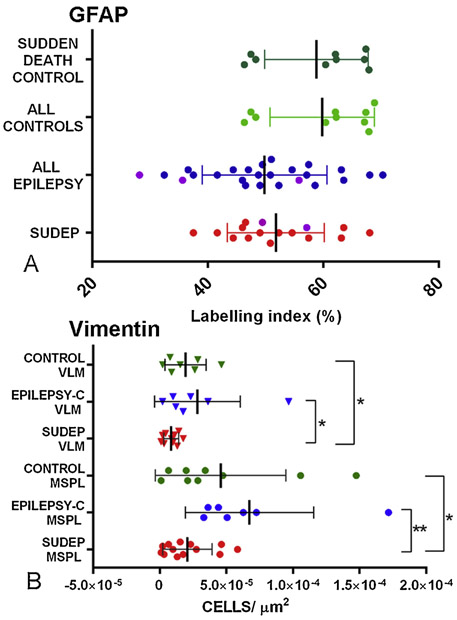
Figure 3. Quantitative analysis.
A. Scatter graph of GFAP showing the ventrolateral medulla (VLM) region only; SUDEP and epilepsy group were lower but not significantly lower compared to non-epilepsy controls (one outlier on the graphs in the control group is not shown). The Dravet syndrome cases in the epilepsy control and SUDEP group are highlighted in purple but these cases were not statistically different from other SUDEP or epilepsy controls as a group. B. Scatter graph of vimentin quantitative analysis with significantly lower cell density in SUDEP group compared to epilepsy controls (p=0.045) and non-epilepsy controls (p=0.02) in the VLM. SUDEP cases also showed lower cell densities in the lateral medullary subpial layer (MSPL) compared to epilepsy controls (p=0.002) and non-epilepsy control groups (p=0.026).

