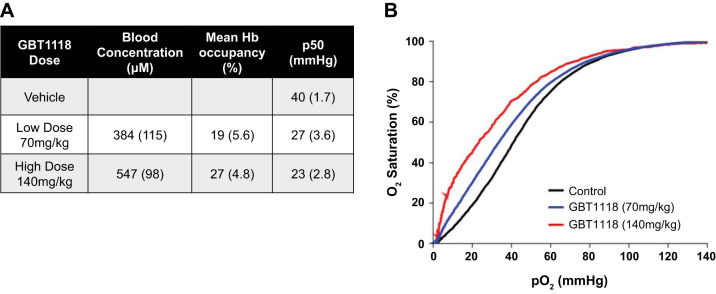
Fig. 2.
Pharmacology of GBT1118 treatment. A: blood concentration and hemoglobin (Hb) occupancy of GBT1118. B: representative Hb-oxygen dissociation curves in the presence and absence of GBT1118. Administration of GBT1118 shifted the Hb dissociation curve to the left and decreased the p50 (Po2 at which blood is 50% saturated with O2) by 13 and 17 mmHg, respectively.

