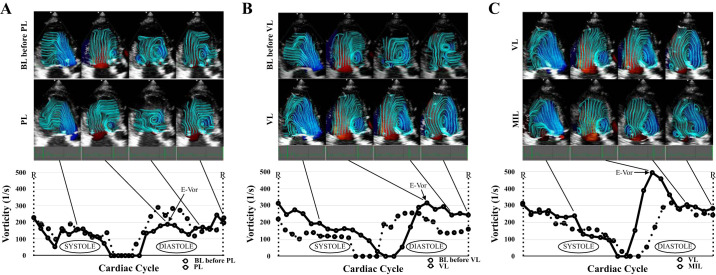
Fig. 1.
Graphs of the vorticity during the cardiac cycle in a dog during the pressure loading (PL) condition (A), volume loading (VL) condition (B), and milrinone (MIL) administration (C). In the superimposed images, the blue lines inside the left ventricle represent streamlines of the blood flow at each time. The diastolic vorticity created two peaks in the cardiac cycle. After the early diastolic blood flow come into the left ventricle, a strong vortex is formed at the septal side of the ventricle, and vorticity is first maximized at this phase (E-Vor). BL, baseline.

