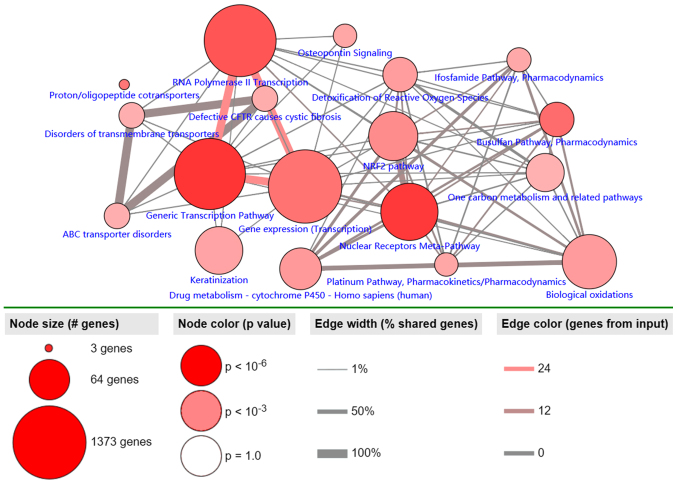
Figure 4.
Significantly enriched pathways of MDGs in LUSC. The node size corresponds to the number of genes, and the node color represents the P-value. This figure only includes the pathways with P<0.001. The edge width represents the percentage of shared genes, and the edge color represents the genes from input. MDG, methylation-driven gene; LUSC, lung squamous cell cancer.

