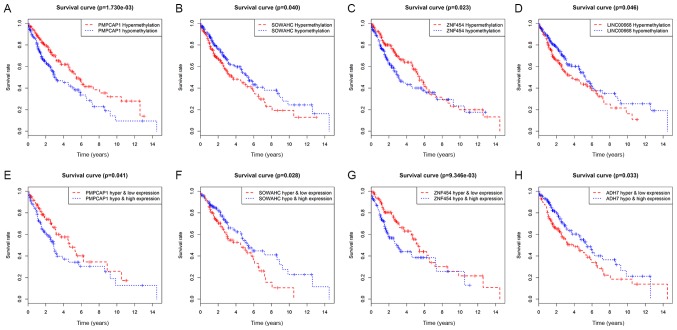
Figure 5.
Survival analysis curves of MDGs with statistical significance in LUSC. Kaplan-Meier survival curves, where the x-axis represents the overall survival time and the y-axis represents the survival rate. (A-D) Survival analysis comparing overall survival and the methylation state of (A) PMPCAP1, (B) SOWAHC, (C) ZNF454 and (D) LINC00668, respectively. (E-H) Joint survival analysis comparing overall survival between hypermethylation/low expression and hypomethylation/high expression of (E) PMPCAP1, (F) SOWAHC, (G) ZNF454 and (H) ADH7, respectively. P<0.05. MDGs, methylation-driven genes; LUSC, lung squamous cell cancer; PMPCAP1, peptidase, mitochondrial processing a subunit pseudogene 1; SOWAHC, sosondowah ankyrin repeat domain family member C; ZNF454, zinc finger protein 454.

